Top 10 Power BI Project Ideas for Beginners to Impress Any Interviewer
Power BI project ideas for beginners are very important for students, freshers, and job seekers who want to build a strong data analyst portfolio. Learning Power BI is good, but showing real dashboard projects in interviews makes your profile much stronger.
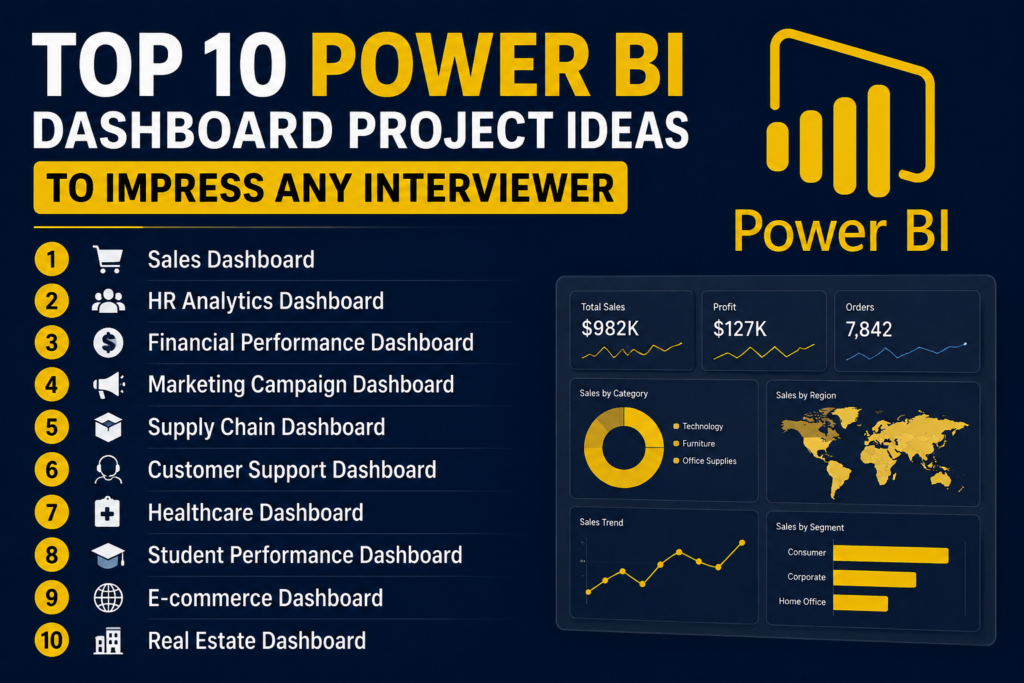
In this blog, you will learn the top 10 Power BI dashboard project ideas that beginners can create to impress interviewers. These projects will help you practice data cleaning, data visualization, DAX basics, KPI cards, charts, slicers, filters, and business insights.
Why Power BI Project Ideas for Beginners Matter
Many students learn Power BI tools, but they do not know how to present their skills in interviews. That is where projects become important. A project shows that you can take raw data, clean it, analyze it, and convert it into a useful dashboard.
For example, saying “I know Power BI” is basic. But saying “I created a sales dashboard that tracks monthly revenue, profit margin, top products, and city-wise performance” sounds much more professional.
Interviewers want to see practical knowledge. They may ask:
What problem did your dashboard solve?
Which KPIs did you track?
What insights did you find?
Which charts did you use and why?
Did you use slicers, filters, or DAX formulas?
This is why power bi project ideas for beginners should not be random. Each project should look like a real business problem. A good Power BI project helps you explain your technical skills and business thinking together.
What Makes a Good Power BI Dashboard Project?
A good Power BI dashboard project should be simple, clear, and useful. Beginners often make the mistake of adding too many colors, charts, and pages. But interviewers prefer dashboards that are easy to understand.
A strong dashboard should include:
| Dashboard Element | Why It Is Important |
|---|---|
| KPI Cards | Show important numbers quickly |
| Charts | Help compare performance |
| Slicers | Allow users to filter data |
| Tables | Show detailed values |
| Clean Layout | Makes the dashboard professional |
| Business Insights | Shows your analytical thinking |
Before creating any dashboard, ask yourself: “What decision can someone make after seeing this report?” If your dashboard answers that question, your project becomes more valuable.
For beginners, the best project format is simple: problem statement, dataset used, tools used, dashboard features, and final insights. This format makes your project easier to explain during interviews.
Top 10 Power BI Project Ideas for Beginners
Below are the best power bi project ideas for beginners that can help you build a job-ready portfolio.
1. Sales Performance Dashboard
A sales dashboard is one of the best Power BI project ideas for beginners because every company tracks sales. This project helps you understand revenue, profit, customers, products, and monthly growth.
In this project, you can create a dashboard for a company that sells products across different cities or regions. Your dashboard should show total sales, total profit, number of orders, top-selling products, best-performing regions, and monthly sales trends.
Important KPIs to include:
| KPI | Meaning |
|---|---|
| Total Sales | Overall revenue generated |
| Total Profit | Final profit after cost |
| Orders | Number of orders received |
| Top Product | Product with highest sales |
| Sales Growth | Monthly or yearly growth |
You can use bar charts for product comparison, line charts for monthly trends, map visuals for location-based sales, and slicers for category, region, and date filtering.
Interview insight example:
“From the dashboard, we can see that the South region generated high sales, but the West region had better profit margin. This means the company should not only focus on revenue but also check profitability.”
2. HR Analytics Dashboard
An HR analytics dashboard is a very impressive beginner project because companies use employee data for hiring, attendance, performance, and retention. This project shows that you can work with business and people-related data.
In this dashboard, you can analyze employee count, department-wise employees, gender ratio, attrition rate, salary range, experience level, and attendance status.
Useful dashboard sections:
| Section | What to Show |
|---|---|
| Employee Overview | Total employees, active employees |
| Department Analysis | Employees by department |
| Attrition Analysis | Employees who left the company |
| Salary Analysis | Average salary by department |
| Attendance Analysis | Present, absent, leave trends |
This project is useful because interviewers can easily understand the business value. HR teams need dashboards to know which department has high attrition, which teams need hiring, and how employee performance is changing.
Interview insight example:
“The dashboard shows that the Sales department has the highest attrition. This may indicate workload pressure, salary concerns, or lack of growth opportunities.”
3. Financial Expense Dashboard
A financial expense dashboard is one of the most practical power bi project ideas for beginners because it helps track income, expenses, savings, and spending patterns. This project is useful for finance companies, small businesses, and personal budgeting.
You can create a dashboard that shows monthly income, total expenses, category-wise spending, savings percentage, and budget vs actual expense.
Important KPIs:
| KPI | Meaning |
|---|---|
| Total Income | Money received |
| Total Expense | Money spent |
| Net Savings | Income minus expenses |
| Budget Usage | How much budget is used |
| Highest Expense Category | Category with most spending |
Use pie charts or donut charts for expense categories, line charts for monthly trends, and KPI cards for income, expenses, and savings.
Interview insight example:
“The dashboard shows that marketing expenses increased by 35% in March, but revenue did not increase at the same rate. This indicates that the business should review campaign performance.”
This project helps you show financial understanding, which is valuable for data analyst roles.
4. E-commerce Sales Dashboard
An e-commerce dashboard is a modern and highly relevant Power BI project. Online businesses need to track orders, revenue, customers, products, returns, and delivery performance.
In this project, you can analyze product categories, customer locations, payment methods, order status, discounts, and profit.
Dashboard pages can include:
| Page | Details |
|---|---|
| Sales Overview | Revenue, orders, profit |
| Product Analysis | Best-selling and low-selling products |
| Customer Analysis | Customer location and repeat buyers |
| Order Analysis | Delivered, cancelled, returned orders |
| Payment Analysis | Payment method performance |
This is one of the best power bi project ideas for beginners because it looks professional and matches real-world business needs.
Interview insight example:
“The dashboard shows that electronics generated the highest revenue, but fashion products had the highest return rate. The company should check product quality, size issues, or customer expectations.”
This project can impress interviewers because it combines sales, customer behavior, and operations.
5. Marketing Campaign Dashboard
A marketing campaign dashboard helps companies understand how their marketing efforts are performing. This project is useful for students interested in digital marketing analytics, business analytics, or performance reporting.
You can analyze campaign cost, impressions, clicks, leads, conversion rate, cost per lead, and return on investment.
Important KPIs:
| KPI | Meaning |
|---|---|
| Impressions | Number of times ad was shown |
| Clicks | Number of people who clicked |
| Leads | Interested customers |
| Conversion Rate | Percentage of users converted |
| Cost Per Lead | Money spent per lead |
Use funnel charts to show customer journey, line charts for campaign performance, and bar charts for platform comparison.
Interview insight example:
“Instagram campaigns generated more clicks, but Google Ads produced better quality leads. This means the company should compare traffic volume with conversion quality.”
This dashboard shows that you understand marketing performance, not just chart creation.
6. Customer Support Dashboard
A customer support dashboard is a powerful beginner project because service-based companies use support data every day. It helps businesses track complaints, response time, ticket status, customer satisfaction, and support team performance.
You can create a dashboard using ticket data with fields like ticket ID, customer name, issue type, priority, status, assigned agent, response time, and resolution time.
Useful KPIs:
| KPI | Meaning |
|---|---|
| Total Tickets | Total customer issues |
| Open Tickets | Pending issues |
| Resolved Tickets | Completed issues |
| Average Response Time | Time taken to reply |
| Customer Satisfaction | Feedback score |
This is one of the best power bi project ideas for beginners because it shows operational analytics. Businesses want to know whether customers are getting quick support.
Interview insight example:
“The dashboard shows that high-priority tickets take longer to resolve during weekends. This means the company may need better weekend support planning.”
This project is simple but very useful for interviews.
7. Healthcare Patient Dashboard
A healthcare dashboard is a strong portfolio project because it shows your ability to handle sensitive and structured data. You can create a dashboard for hospital patient visits, doctor appointments, treatment categories, billing, and patient demographics.
Dashboard sections can include:
| Section | Details |
|---|---|
| Patient Overview | Total patients, new patients |
| Department Analysis | Patients by department |
| Appointment Status | Completed, cancelled, pending |
| Billing Summary | Total billing and payment status |
| Age Group Analysis | Patients by age category |
You can use column charts, cards, slicers, and trend visuals to present healthcare data clearly.
Interview insight example:
“The dashboard shows that the general medicine department receives the highest number of patients on Mondays. The hospital can use this insight to plan staff availability.”
This project is helpful for beginners who want to show data analytics skills beyond sales and finance.
8. Inventory Management Dashboard
Inventory dashboards are used by retail, warehouse, manufacturing, and e-commerce companies. This project helps you understand stock levels, product movement, reorder status, supplier performance, and inventory value.
Important KPIs include:
| KPI | Meaning |
|---|---|
| Total Stock | Available quantity |
| Low Stock Items | Products needing reorder |
| Inventory Value | Total stock value |
| Fast-Moving Products | Products selling quickly |
| Slow-Moving Products | Products with low sales |
Use tables for product-level details, bar charts for category-wise stock, and conditional formatting to highlight low-stock products.
Interview insight example:
“The dashboard shows that some high-demand products are frequently going out of stock. This can affect sales, so the company should improve reorder planning.”
This is one of the most business-focused power bi project ideas for beginners because it connects directly with operations and cost control.
9. Student Performance Dashboard
A student performance dashboard is a beginner-friendly project for education institutes, training centers, and online learning platforms. This project helps track student marks, attendance, course completion, assignments, and performance improvement.
You can include:
| Dashboard Area | What to Track |
|---|---|
| Student Overview | Total students and active students |
| Attendance | Present and absent percentage |
| Marks Analysis | Subject-wise performance |
| Course Progress | Completion percentage |
| Top Performers | Students with highest marks |
This project is simple to understand and easy to explain in interviews.
Interview insight example:
“The dashboard shows that students with attendance below 70% have lower average marks. This suggests that attendance is strongly connected to academic performance.”
For beginners, this is a great project because the data is easy to imagine and the insights are clear.
10. Banking Loan Analysis Dashboard
A banking loan dashboard is a very impressive project because it looks professional and analytical. Banks and finance companies use dashboards to track loan applications, approved loans, rejected loans, customer income, repayment status, and risk categories.
Important KPIs:
| KPI | Meaning |
|---|---|
| Total Loan Applications | Number of loan requests |
| Approved Loans | Accepted applications |
| Rejected Loans | Not approved applications |
| Loan Amount | Total amount requested |
| Default Risk | Customers at repayment risk |
You can analyze loan approval by income group, employment type, credit score, location, and loan purpose.
Interview insight example:
“The dashboard shows that customers with low credit scores and high loan amounts have higher rejection rates. This helps the bank understand risk patterns.”
This is one of the strongest power bi project ideas for beginners because it shows business understanding, finance logic, and data visualization skills together.
Best Power BI Project Ideas for Beginners: Quick Comparison
| Project Idea | Difficulty Level | Best For |
|---|---|---|
| Sales Dashboard | Easy | Freshers and beginners |
| HR Analytics Dashboard | Easy | HR and business analytics |
| Financial Expense Dashboard | Easy | Finance analytics |
| E-commerce Dashboard | Medium | Business and product analytics |
| Marketing Dashboard | Medium | Digital marketing analytics |
| Customer Support Dashboard | Easy | Service analytics |
| Healthcare Dashboard | Medium | Healthcare analytics |
| Inventory Dashboard | Medium | Operations analytics |
| Student Performance Dashboard | Easy | Education analytics |
| Banking Loan Dashboard | Medium | Finance and banking analytics |
If you are completely new, start with a sales dashboard or HR dashboard. If you want to impress interviewers more, try e-commerce, inventory, or banking loan analysis projects.
How to Explain Power BI Projects in an Interview
Creating a dashboard is only half the work. You should also know how to explain it clearly.
Use this simple format:
Problem Statement: What business problem did you solve?
Dataset: What type of data did you use?
Data Cleaning: What changes did you make?
Dashboard Features: Which visuals, slicers, and KPIs did you add?
Insights: What did you discover?
Business Recommendation: What action should the company take?
Example answer:
“I created a sales performance dashboard using Power BI. The dashboard tracks total sales, profit, orders, region-wise performance, and product category trends. I used slicers for date, region, and category. The main insight was that one region had high sales but low profit, so the company should review discounts and product pricing in that region.”
This type of explanation sounds professional and interview-ready.
FAQ: Power BI Project Ideas for Beginners
What are the best power bi project ideas for beginners?
The best power bi project ideas for beginners include sales dashboards, HR analytics dashboards, financial dashboards, e-commerce dashboards, marketing dashboards, inventory dashboards, and banking loan dashboards.
Can beginners create Power BI dashboards without coding?
Yes, beginners can create Power BI dashboards without coding. Basic Excel knowledge, data cleaning, visualization skills, and Power BI practice are enough to start.
Which Power BI project is best for interviews?
Sales dashboard, e-commerce dashboard, HR analytics dashboard, and banking loan analysis dashboard are great Power BI projects for interviews.
How many Power BI projects should I add to my resume?
You can add 2 to 4 strong Power BI projects to your resume. Focus on dashboard quality, KPIs, insights, and business explanation.
Do I need SQL for Power BI projects?
SQL is not compulsory for every beginner project, but it is very helpful for collecting, filtering, and preparing business data.
What should a beginner Power BI dashboard include?
A beginner Power BI dashboard should include KPI cards, charts, slicers, filters, tables, clean layout, and business insights.
Where can I find datasets for Power BI projects?
You can find datasets on Kaggle, Microsoft sample datasets, government open data websites, and public business data sources.
Can Power BI projects help me get a data analyst job?
Yes, Power BI projects can improve your job chances because they show practical dashboard skills, reporting ability, and business understanding.
How long does it take to learn Power BI?
With regular practice, beginners can learn basic Power BI dashboard creation in 1 to 2 months.
Where can I learn Power BI with real-time projects?
You can learn Power BI with real-time projects at Fast Learning Technologies, Nagavara, with practical training and placement support.
Final Thoughts
These power bi project ideas for beginners can help you build a strong portfolio and impress interviewers. Do not create dashboards only for design. Create dashboards that solve real business problems.
Start with simple projects like sales, HR, and finance dashboards. Then move to advanced beginner projects like e-commerce, inventory, marketing, and banking loan analysis. Practice explaining your dashboard with problem statements, KPIs, insights, and recommendations.