Data Analytics Course with Placement Bangalore
Looking for a practical and career-focused data analytics course with placement bangalore? Fast Learning Technologies
200+
Placed
Rs. 4.5 LPA
Average Salary
50+
Companies
Live
Delivery Mode
3-4 Months
Duration
5+Live
Real time projects
24/7
Mentor support
Data analytics training in bangalore
Looking for a practical and career-focused data analytics course with placement bangalore? Fast Learning Technologies offers a structured Data Analytics training program designed for students, fresh graduates, working professionals, career switchers, and anyone who wants to build a strong career in data analysis, business intelligence, reporting, and data-driven decision-making.
Bangalore is one of India’s leading technology and business hubs. Companies across IT, finance, healthcare, e-commerce, retail, education, logistics, startups, and consulting use data every day to make better decisions. Because of this, skilled data analysts are in high demand.
At Fast Learning Technologies, our Data Analytics course helps learners build strong practical skills in Excel, SQL, Python, Power BI, data cleaning, data visualization, dashboard creation, business reporting, and real-time projects. The course is designed to make data analytics simple, professional, and job-oriented.
Whether you are a beginner or someone with basic technical knowledge, our training helps you learn step by step and prepare for entry-level data analytics roles with confidence.

What Makes Fast Learning Technologies a Trusted Choice?
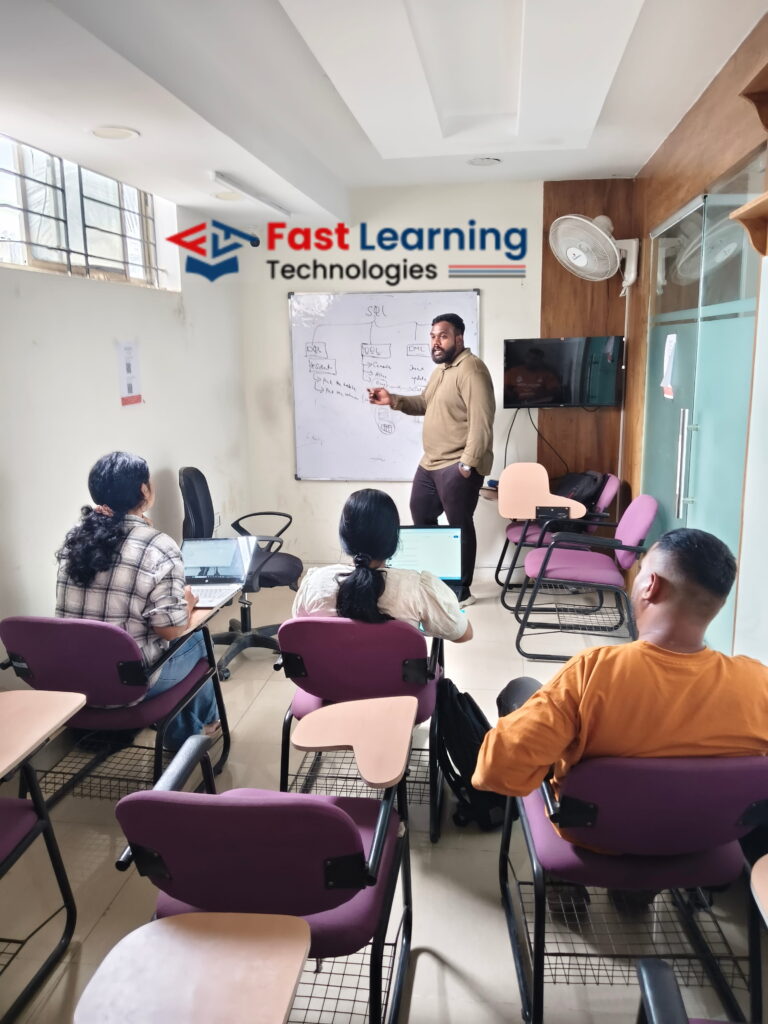
Fast Learning Technologies focuses on practical learning, clear explanations, and career-ready training. We understand that many learners want to enter the data analytics field but feel confused about tools, job roles, technical skills, and interview preparation.
Some students think data analytics is only for coding experts. Some working professionals feel they are late to switch careers. Some freshers do not know how to create a strong project portfolio. Our course is designed to solve these problems with a simple and structured learning path.
We teach analytics through real examples, practical datasets, reporting tasks, dashboards, and business case studies. Instead of only explaining concepts, we help students practice the work that data analysts perform in companies.
Our data analytics training in Bangalore is built to help learners gain confidence in using data to solve business problems.
What Makes Our Data Analytics Course Different?
Our training focuses on:
- Beginner-friendly learning approach
- Practical training on analytics tools
- Excel, SQL, Python, and Power BI concepts
- Real-time projects and datasets
- Business reporting and dashboard practice
- Resume preparation and interview support
- Placement-oriented guidance
- Local Bangalore job market relevance
Our Alumni's Are Placed At

Course Curriculum - Data analytics training in Bangalore
1. Introduction
- MS Office versions: similarities and differences
- Interface of the latest available version
- Rows and columns
- Keyboard shortcuts for easy navigation
- Data entry using Fill Series
- Find and Select
- Clear options
- Ctrl + Enter
- Formatting options
- Font
- Alignment
- Clipboard
- Copy
- Paste Special
2. Referencing, Named Ranges, Uses, and Arithmetic Functions
- Mathematical calculations with cell referencing
- Absolute reference
- Relative reference
- Mixed reference
- Functions with named ranges
3. Logical and Lookup Functions
- LOOKUP
- VLOOKUP
- Nested VLOOKUP
- HLOOKUP
- INDEX
- Arithmetic functions
- SUM
- SUMIF
- SUMIFS
- COUNT
- COUNTA
- COUNTIFS
- AVERAGE
- AVERAGEIFS
- MAX
- MAXIFS
- MIN
- MINIFS
- Logical functions
- IF
- AND
- OR
- Nested IFs
- NOT
- IFERROR
- Usage of mathematical and logical functions nested together
4. Referring Data from Different Tables
- Various types of Lookup
- Nested IF
- INDEX with MATCH function
- INDIRECT
- OFFSET
5. Advanced Functions
- Combination of arithmetic functions
- Combination of logical functions
- Combination of lookup functions
- Data validation with dependent dropdown
6. Date and Text Functions
Date Functions
- DATE
- DAY
- MONTH
- YEAR
- YEARFRAC
- DATEDIF
- EOMONTH
Text Functions
- TEXT
- UPPER
- LOWER
- PROPER
- LEFT
- RIGHT
- SEARCH
- FIND
- MID
- TTC
- Flash Fill
7. Data Handling
- Data cleaning
- Data type identification
- Remove duplicates
- Formatting and filtering
- Number formatting with shortcuts
- Ctrl + T: converting data into an Excel table
- Formatting table
- Remove duplicates
- SORT
- Advanced Sort
- FILTER
- Advanced Filter
8. Data Visualization
Conditional Formatting
- Icon sets
- Highlighted colour sets
- Data bars
- Custom formatting
Charts
- Bar chart
- Column chart
- Line chart
- Scatter chart
- Combo chart
- Gantt chart
- Waterfall chart
- Pie chart
9. Data Summarization: Pivot Reports and Charts
- Pivot reports
- Insert Pivot Table
- Pivot interface
- Crosstable reports
- Filters
- Pivot charts
- Slicers
- Add slicers
- Connect slicers to multiple reports and charts
- Calculated field
- Calculated item
10. Data Summarization: Dashboard Creation, Tips, and Tricks
- Dashboard types
- Getting reports and charts together
- Use of slicers
- Power Query interface
- Power Query tabs
- Data cleaning
- Data transformation
- Design and placement
- Formatting tables
- Formatting charts
- Formatting sheets
- Proper use of colours and shapes
11. Connecting to Data: Power Query, Pivot, and Power Pivot
- Connecting data from other Excel files
- Connecting data from text files
- Connecting data from other sources
- Loading data into Excel Query
- Using loaded queries
- Merge and Append
- Insert Power Pivot
- Similarities and differences between Pivot and Power Pivot reporting
- Getting data from databases
- Getting data from workbooks
- Getting data from webpages
12. VBA and Macros
- View tab
- Add Developer tab
- Record Macro
- Macro name
- Macro storage
- Record macro to format table using absolute reference
- Format table of any size using relative reference
- Play macro by button
- Play macro by shape
- Play macro as command in a new tab
- Editing macros
13. VBA Basics
- Introduction to the basics of working with VBA for Excel
- Subs
- Ranges
- Sheets
- Comparing values and conditions
- IF statements
- Select Case
- Repeat processes using loops
- For loops
- Do While loops
- Do Until loops
- Communicating with end-users
- Message boxes
- Input boxes
- User Forms
1. Introduction to MySQL
- Introduction to databases
- Introduction to RDBMS
- Explanation of RDBMS through normalization
- Different types of RDBMS
- Software installation
- MySQL Workbench
2. SQL Commands and Data Types
- Types of SQL commands and their applications
- DDL
- DML
- DQL
- DCL
- TCL
- Data types in SQL
- Numeric
- Character
- Date and time
3. DQL and Operators
- SELECT
- LIMIT
- DISTINCT
- WHERE
- AND
- OR
- IN
- NOT IN
- BETWEEN
- EXISTS
- IS NULL
- IS NOT NULL
- Wildcards
- ORDER BY
4. CASE WHEN THEN and Handling NULL Values
- Usage of CASE WHEN THEN to solve logical problems
- Handling NULL values
- IFNULL
- COALESCE
5. Group Operations and Aggregate Functions
- GROUP BY
- HAVING clause
- COUNT
- SUM
- AVG
- MIN
- MAX
- String functions
- Date and time functions
6. Constraints
- NOT NULL
- UNIQUE
- CHECK
- DEFAULT
- Primary Key
- Foreign Key
- Column-level foreign key
- Table-level foreign key
7. Joins
- INNER JOIN
- LEFT JOIN
- RIGHT JOIN
- CROSS JOIN
- SELF JOIN
- FULL OUTER JOIN
8. DDL Commands
- CREATE
- DROP
- ALTER
- RENAME
- TRUNCATE
- MODIFY
- COMMENT
9. DML and TCL Commands
DML Commands
- INSERT
- UPDATE
- DELETE
TCL Commands
- COMMIT
- ROLLBACK
- SAVEPOINT
- Data partitioning
10. Indexes and Views
- Indexes
- Different types of indexes
- Views in SQL
11. Stored Procedures
- Procedure with IN parameter
- Procedure with OUT parameter
- Procedure with INOUT parameter
12. Functions and Constructs
- User-defined functions
- Window functions
- RANK
- DENSE_RANK
- LEAD
- LAG
- ROW_NUMBER
13. Union, Intersect, and Sub-query
- UNION
- UNION ALL
- INTERSECT
- Subqueries
- Multiple queries
14. Exception Handling
- Handling exceptions in a query
- CONTINUE handler
- EXIT handler
15. Triggers
- Triggers before DML statement
- Triggers after DML statement
1. Power BI Introduction and Installation
- Understanding Power BI background
- Formatting and setting prerequisites
- Installation of Power BI
- Checklist for perfect installation
- Understanding the difference between Power BI Desktop and Power Query
2. Power BI User Interface, Data Sources, and Visualizations
- Getting familiar with Power BI Query and Desktop interface
- Understanding types of visualization
- Loading data from multiple sources
- Data types and default chart type on drag and drop
- Geo-location map integration
3. Sample Dashboard with Animated Visuals
- Financial sample data in Power BI
- Preparing a sample dashboard to get started
- Map visual types and their usage in different variations
- Understanding Scatter Plot chart with Play Axis and parameters
4. Power BI Artificial Intelligence Visuals
- Understanding the use of AI in Power BI
- AI analysis in Power BI using charts
- Q&A chatbot and its real-life usage
- Hierarchy tree
5. Power BI Visualization
- Understanding Column Chart
- Understanding Line Chart
- Implementation of conditional formatting
- Implementation of formatting techniques
6. Power Query Editor
- Loading data from a folder
- Understanding Power Query in detail
- Promote headers
- Split delimiter
- Add columns
- Append queries
- Merge queries
7. Modelling with Power BI
- Loading multiple data from different formats
- Understanding modelling
- How to create relationships
- Connection type
- Data cardinality
- Filter direction
- Making dashboard using newly loaded data
8. Power Query Editor: Filter Data
- Power Query Custom Column
- Power Query Conditional Column
- Manage Parameter
- Introduction to filters
- Types of filters
- Trend analysis
- Future forecast
9. Customizing Data in Power BI
- Understanding Tooltips with information
- Use and understanding of Drill Down
- Visual interaction
- Customization of visual interaction
- Drill Through function and usage
- Button triggers
- Bookmarks and their different uses
- Bookmark implementation
- Navigation buttons
10. DAX Expressions
- Introduction to DAX
- Table DAX
- Calculated column
- DAX measure
- Difference between calculated column and measure
- Examples
- Calendar
- Calendar Auto
- Summarize
- Group By
- Calculated Column
- Related
- Lookup Value
- Switch
- DATEDIF
- RANKX
- Date functions
- DAX Measure and Quick Measure
- Remove Filters
- Keep Filters
- ALL
- ALLSELECTED
- Time Intelligence Functions
- Rolling Average
- YoY
- Running Total
11. Custom Visuals
- Custom visuals and understanding their usage
- Loading custom visuals
- Pinning visuals
- Loading to template for future use
- Publishing Power BI report
12. Power BI Service
- Introduction to app.powerbi.com
- Schedule refresh
- Data flow
- Using Power BI online
- Downloading data live in PowerPoint and more
1. Introduction to Tableau
- What is Tableau?
- What is Data Visualization?
- Tableau products
- Tableau Desktop variations
- Tableau file extensions
- Data types
- Dimensions
- Measures
- Aggregation concept
- Tableau Desktop installation
- Data source overview
- Live vs Extract
2. Basic Charts and Formatting
- Overview of worksheet sections
- Shelves
- Bar Chart
- Stacked Bar Chart
- Discrete Line Chart
- Continuous Line Chart
- Symbol Map
- Filled Map
- Text Table
- Highlight Table
- Formatting options
- Remove grid lines
- Hide axes
- Convert numbers to thousands and millions
- Shading
- Row divider
- Column divider
- Marks Card
3. Filters
- What are filters?
- Types of filters
- Extract filter
- Data source filter
- Context filter
- Dimension filter
- Measure filter
- Quick filter
- Order of operation of filters
- Cascading filters
- Apply filters to worksheets
4. Calculations
- Need for calculations
- Types of calculations
- Basic calculations
- LOD calculations
- Table calculations
- Examples of basic calculations
- Aggregate functions
- Logical functions
- String functions
- Tableau calculation functions
- Numerical functions
- Date functions
- LOD calculations with examples
- Table calculations with examples
5. Data Combining Techniques
- What are data combining techniques?
- Types of data combining techniques
- Joins
- Relationships
- Blending
- Union
6. Custom Charts
- Dual Axis
- Combined Axis
- Donut Chart
- Lollipop Chart
- KPI Cards
- Simple KPI Cards
- KPI Cards with Shape
7. Groups, Bins, Hierarchies, Sets, and Parameters
- Groups
- Purpose of groups
- Bins
- Purpose of bins
- Hierarchies
- Purpose of hierarchies
- Sets
- Purpose of sets
- Parameters
- Purpose of parameters
- Examples of parameters
8. Analytics and Dashboard
- Reference Lines
- Trend Line
- Overview of Dashboard
- Tiled layout
- Floating layout
- Overview of all dashboard objects
- Layout overview
- Dashboard creation with formatting
9. Dashboard Actions and Tableau Public
- Dashboard actions
- Filter action
- Highlight action
- URL action
- Sheet action
- Parameter action
- Set action
- How to save the workbook to Tableau Public website?
1. Anaconda Installation and Introduction to Python
- Anaconda installation
- Introduction to Python
- Variables
- Data types
- Integer
- Boolean
- Float
- List
- Tuple
- String
- Operators in Python
2. Data Types Continued, Slicing, and Inbuilt Functions
- Dictionaries
- Slicing the data
- Sequence methods
- Concatenation
- Repetition
- LEN function
- MIN function
- MAX function
- Index position
- Addition of elements
- Deletion of elements
- Reverse
- Sorting
3. Sets, Set Theory, Regular Expressions, and Decision-Making Statements
- Sets
- Set theory
- Regular expressions using
remodule- findall
- search
- split
- match
- Decision-making statements
- IF
- ELSE IF
- ELSE
- Getting input from user
- Identity operators
4. Loops, Functions, Lambda Functions, and Modules
- Loops
- FOR loop
- WHILE loop
- Functions
- Lambda functions
- Modules
- Math module
- Calendar module
- Date and Time module
5. Pandas, NumPy, Matplotlib, and Seaborn
- DataFrame creation using different methods
- Using Pandas analysis on universities
- Salary datasets
- Visualization using Matplotlib
- Visualization using Seaborn
- NumPy introduction
Hands-On Projects to Strengthen Your Portfolio
End-to-End Customer Churn Analysis and Prediction System (Domain: Telecom)
Tools Used: Python, Power BI, Excel, SQL Collect and clean telecom customer data, analyze usage patterns, identify churn reasons, build predictive models, and create interactive dashboards for business insights.
Hospital Management and Patient Insights Analytics Project (Domain: Healthcare)
Tools Used: Python, Power BI, Excel, SQL Perform complete analysis of patient admissions, doctor performance, treatment costs, disease trends, and hospital resource utilization with real-time dashboards.
E-Commerce Business Sales and Customer Analytics Platform (Domain: Retail & E-Commerce)
Tools Used: Python, Power BI, Excel, SQL Analyze customer purchasing behavior, sales performance, product demand, profit margins, and regional sales trends to improve business decision-making.
Employee Performance and HR Analytics Management System (Domain: Human Resources)
Tools Used: Python, Power BI, Excel, SQL Analyze employee attendance, productivity, salary trends, attrition rates, and recruitment data to optimize workforce management.
Banking Loan Risk and Financial Fraud Detection Analysis (Domain: Banking & Finance)
Tools Used: Python, Power BI, Excel, SQL Analyze customer financial history, loan approvals, repayment behavior, and suspicious transactions to identify fraud risks and improve loan decision processes.
Trainer profile

Arun
Data Analytics Trainer | 12 Years Experience
He helps students understand analytics concepts, tools, and real-time business applications with ease.
Kiran
Data Analytics Trainer | 8 Years Experience
He guides learners through practical examples, dashboards, reports, and analytical techniques.
Dibya Jyoti
Data Analytics Trainer | 4 Years Experience
He explains concepts clearly and supports learners with hands-on practice and project-based learning.
Nishanth
Data Analytics Trainer | 5 Years Experience
He specializes in practical training with tools, case studies, and real-world data examples.
Sathish
Data Analytics Trainer | 6 Years Experience
He trains students to develop job-ready skills through practical sessions and industry-based examples.
Praveen
Data Analytics Trainer | 3 Years Experience
He helps students gain confidence in data analysis, visualization, and basic analytics tools.
Course batch schedule - Bangalore
| Date | Course | Batch | Timings |
|---|---|---|---|
| 22 Jul | Python | New Batch | 8 AM - 9 AM |
| 22 Jul | SQL | New Batch | 6 PM - 7 PM |
| 27 Jul | Excel | New Batch | 9 AM - 10 AM |
| 27 Jul | Power BI | New Batch | 2 PM - 3 PM |
| 29 Jul | AWS | New Batch | 5 PM - 6 PM |
| 29 Jul | Frontend | New Batch | 10 AM - 11 AM |
| 03 Aug | Linux | New Batch | 4 PM - 5 PM |
| 05 Aug | Data Science | New Batch | 8 AM - 9 AM |
| 05 Aug | Machine Learning | New Batch | 5 PM - 6 PM |
| 10 Aug | AI | New Batch | 8 AM - 9 AM |
Get Certified & Prove Your Industry Readiness
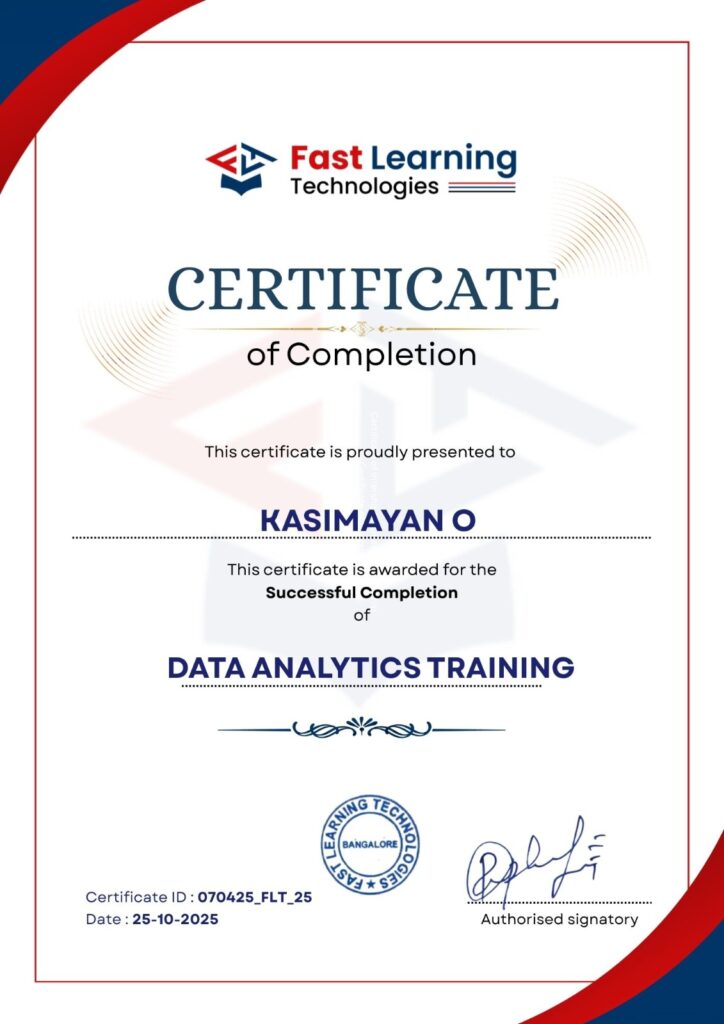
Once you complete the course, submit your projects, and pass the assessments, you’ll receive a certificate that proves your technical skills and industry readiness, recognized by the Govt of India.
Shareable, Credible, and Official
Add your certificate to LinkedIn and share it on WhatsApp, email, or other platforms to make your profile stand out to recruiters.
Boost Your Career Opportunities
Our certificate validates your skills, increasing your chances of landing jobs with better salaries and growth potential.
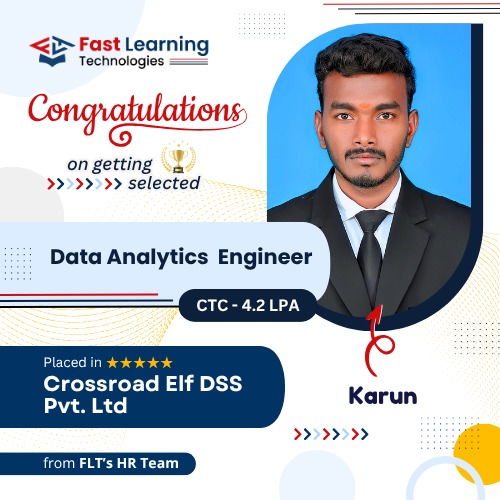
Students Placements



EXCELLENTTrustindex verifies that the original source of the review is Google. I was looking for a training institute that provides both course training and internship opportunities, and Fast Learning Technologies was the right choice. The trainers are knowledgeable and supportive. The hands-on training, real-time projects, internship experience, and placement assistance helped me improve my skills and confidence. Highly recommended for anyone looking to start a career in IT.Posted on GoogleTrustindex verifies that the original source of the review is Google. I was searching for a Data Analytics course and found Fast Learning Technologies. One of the best institutes for learning with hands-on training. They also provide internship opportunities. I completed my Data Analytics internship here and gained practical experience through real-time projects. The trainers are supportive and the learning environment is excellent. Highly recommended for anyone looking to start a career in Data Analytics.Posted on GoogleTrustindex verifies that the original source of the review is Google. One of the best institutes for learning Python with hands-on training. They also provide Python internship opportunities, which helped me gain practical experience and improve my skills. The trainers are supportive, and the training includes real-time practice. Highly recommended for students and job seekers looking to build a career in Python.Posted on GoogleTrustindex verifies that the original source of the review is Google. Cloud and DevOps course is very informative and practical. Trainers provide hands-on training with real-time scenarios. The HR team support is good for placements. Best IT training in Nagawara.Posted on GoogleTrustindex verifies that the original source of the review is Google. Currently learning Data Science, the trainers are knowledgeable, approachable. The class rooms are well arranged with enough chairs and boards also equipped with Big monitors for explanation. The management and staff are professional, kind and approachable also knowledge about the courses. The demo class with Kiran is honest with career councelling and opportunities also structure of the course. My overall experience far is amazing.Posted on GoogleTrustindex verifies that the original source of the review is Google. I joined Data Analytics training near Manyata Tech Park after a long career gap. Kiran sir motivated me and provided excellent hands on training. Real time projects helped me rebuild my confidence. Best data analytics training in bangalore manyata tech park.Posted on GoogleTrustindex verifies that the original source of the review is Google. Joined fot Data anlyst course. Demo classes were provided. The trainers are knowledgeable, The class rooms are equipped with advanced technology, Air conditioning (even if students visit for practice purpose). Staff is professional and well knowledgeable about courses and most importantly they are patient enough to listen and understand to us and well approachable.Posted on GoogleTrustindex verifies that the original source of the review is Google. HR team support is very good, they guided me during placement
Data Analytics Course Fee and Duration
Classroom Sessions
35,000/- including taxes
- Fees payable in up to 3 installments
- 0% Interest EMI – Pay in Easy Installments (though education financing partners)
- Cost-effective courses with high ROI, making it worth every penny you invest.
Frequently Asked Questions (FAQ)
Fast Learning Technologies offers a practical data analytics course with placement support in Bangalore. The course covers Excel, SQL, Python, Power BI, dashboards, real-time projects, resume guidance, and interview preparation.
Yes. Beginners can join this course. The training starts from basic data analytics concepts and gradually moves to Excel, SQL, Python, Power BI, projects, and interview preparation.
The course covers important analytics tools and concepts such as Excel, SQL, Python basics, data cleaning, data visualization, Power BI dashboards, business reporting, and real-time projects.
After completing the course and gaining enough practice, you can apply for roles such as Data Analyst, Business Analyst, MIS Executive, Reporting Analyst, SQL Analyst, Power BI Developer, and Analytics Associate.
Yes. Bangalore has a strong IT, startup, and business ecosystem. Many companies use data for reporting, decision-making, customer analysis, finance, marketing, and operations. Data analytics can be a strong career option for freshers and professionals.